GAIN AN ADVANTAGE WITH
THE NEW 2.0 FEATURES
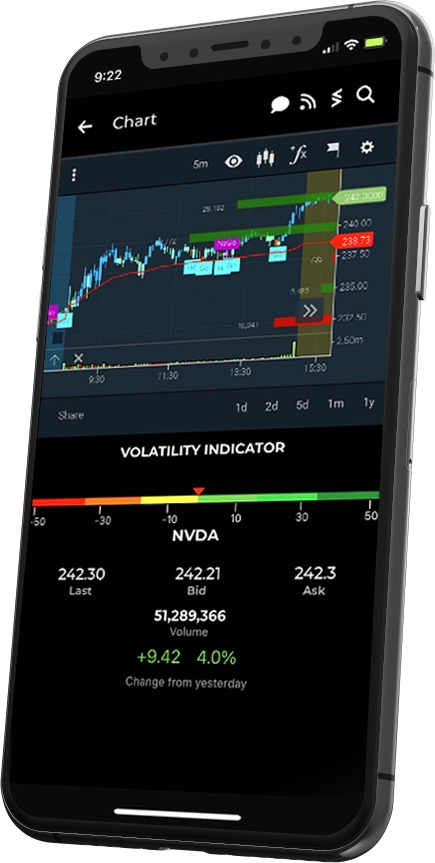
Blends robust statistical tools into a simple color coded charting of a security's price according to the strength of its trend. More insight into the continuity of a trend for better risk management
Shows a clear picture of how market makers are hedging to control risk which can create buying and selling pressure on a stock. This is a great indicator for anticipating a potential directional move of a stock.
Provides a breakdown of the Net Options Delta (NOD) for Calls, Puts, and the total NOD. Used as an indicator to determining a potential directional trend of an underlying equity.
Displays the net difference between buys versus sells. The data is broken down into weekly and monthly expirations to view how smart money is moving in or out of shorter and longer contracts.
THE DARK POOL
Chart The Dark Pool
Our Dark Pool Volume Profile study is designed to show at which price points large trade volume is occurring. This unique chart study can be used to plot secondary support and resistance levels for trade entries and exits.Join the growing number of professional traders that have added Blackbox 2.0 to their arsenal of trading tools. Our proprietary analytics and chart studies provide unparalleled insight into the stock and options market!

Our 5 Star Experience


